#Webhooks overview
#Overview
This document shares general information about the use of webhooks with Hygraph, such as configuring webhooks, viewing logs, and editing or deleting webhooks.
For specific information about the use of webhooks with external apps, please access the corresponding guide using the left side navigation menu.
#Configure webhooks
To configure webhooks, follow these steps:
 Add a webhook
- In your project, navigate to Project Settings > AI & Automation > Webhooks.
- Click
Add webhook. - The
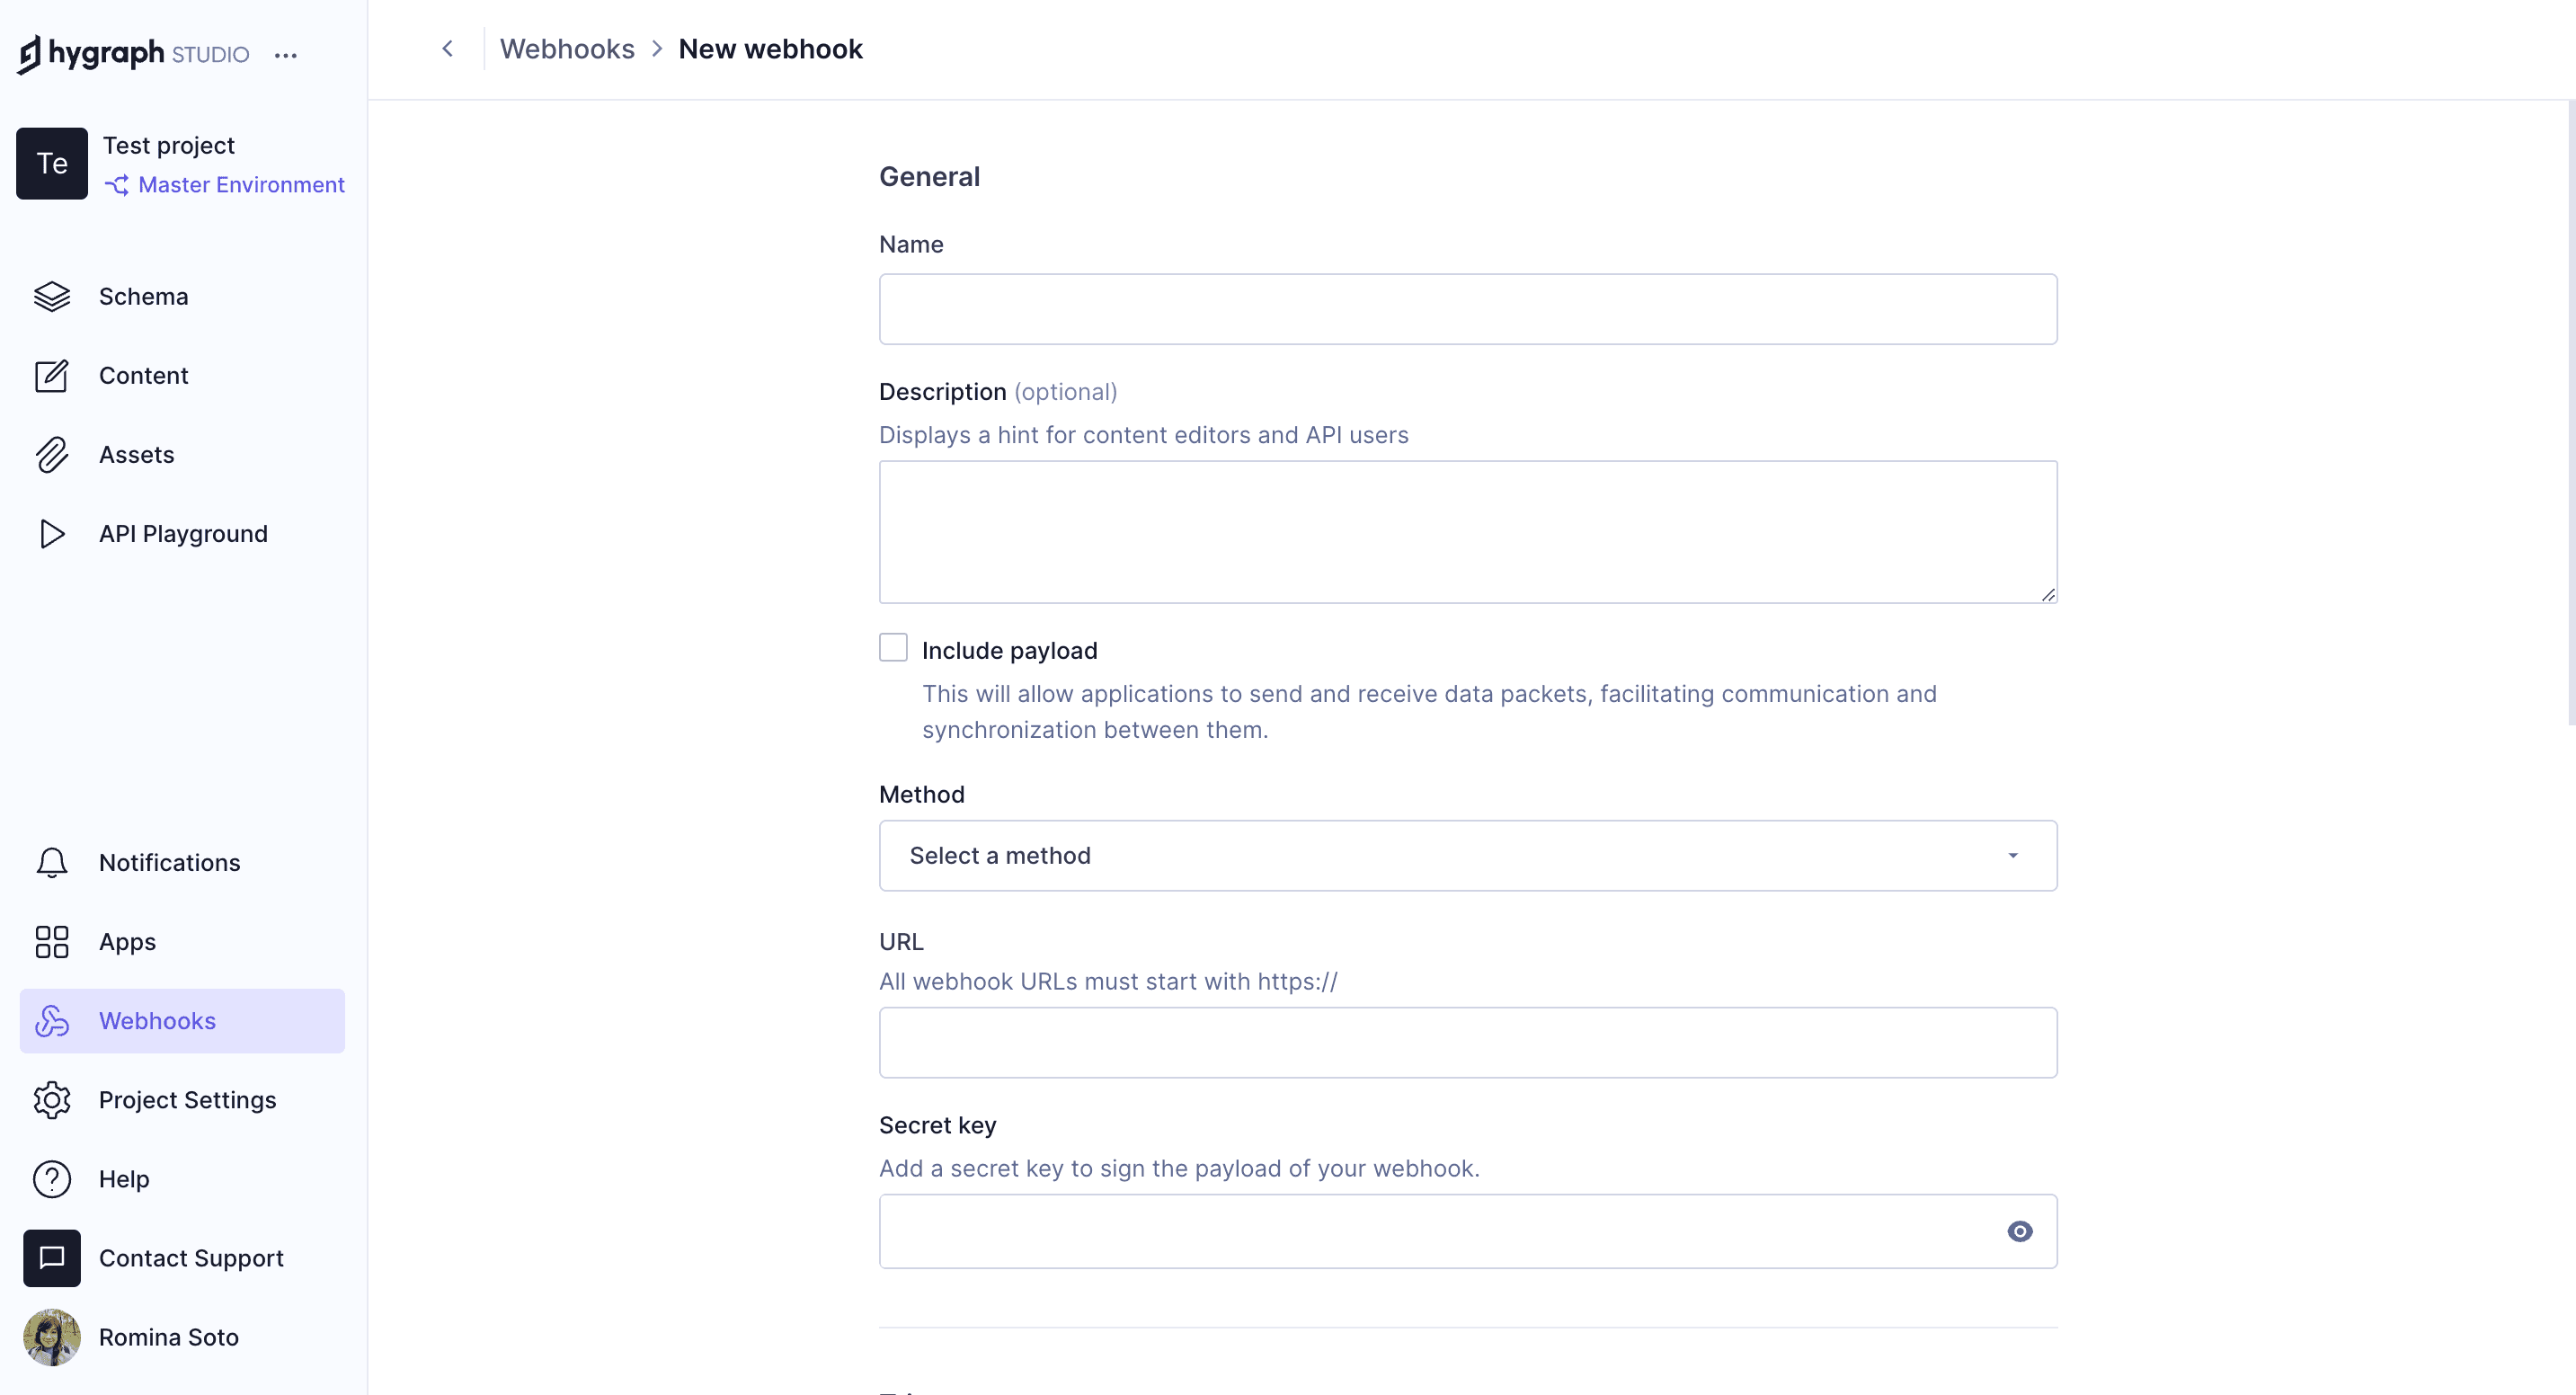
Add webhookscreen will display. Complete the following information:- Name: Name for your webhook.
- Description: Description for your webhook. Optional field.
- Include payload: Select this checkbox to allow applications to send and receive data packets.
- Method: Dropdown menu that allows you to select an HTTP method from a list. You can select POST, DELETE, GET or PUT.
- URL: Webhook URL. This is information that you will get from the connected app. Please check the corresponding guide for specific information about this.
- Secret key: You can optionally add a secret key to sign the payload of your webhook. The secret key allows the other end to check that the source is genuine. You can use this to verify requests and, for instance, avoid triggering deploys from unknown sources.
- Triggers: This is where you select which Models, Stages, Actions and Sources should trigger your webhook. Each item has a dropdown menu, where you can select one or more options. Selecting none acts as a wildcard, then all models will trigger the webhook. This document contains some more information on triggers.
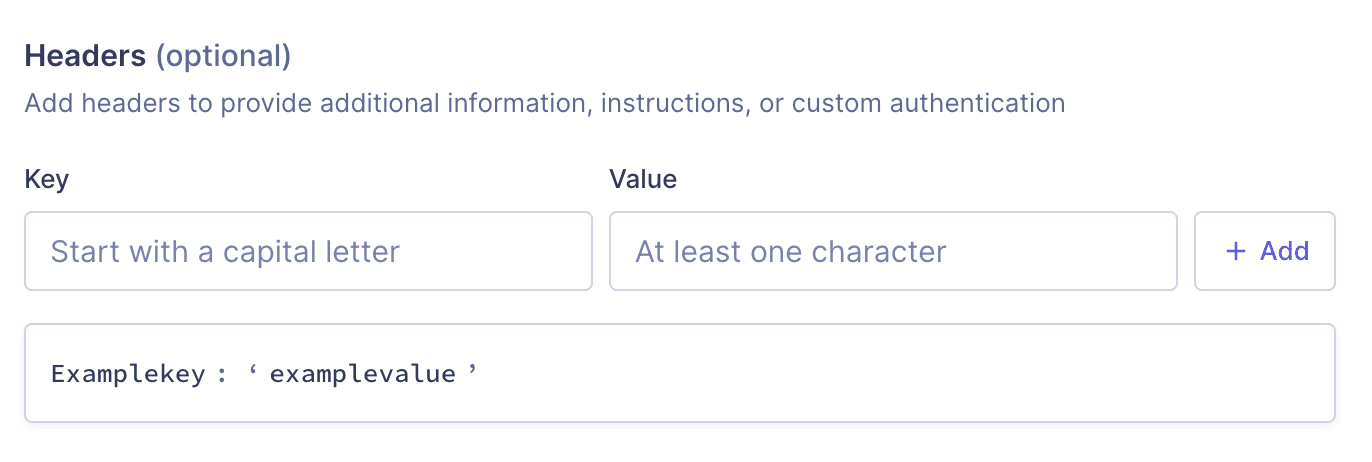
- Headers: Here you can configure your headers by adding additional Key and Value data, then clicking
+ Add. You can add multiple key-value sets, and you can delete the ones you added by selecting theRemoveoption in the context menu. Some endpoints require authentication using API Keys, which could be set here. Webhook headers
#View webhook logs
- In your project, navigate to Project Settings > AI & Automation > Webhooks.
- Click View logs next to the webhook for which you want to check logs.
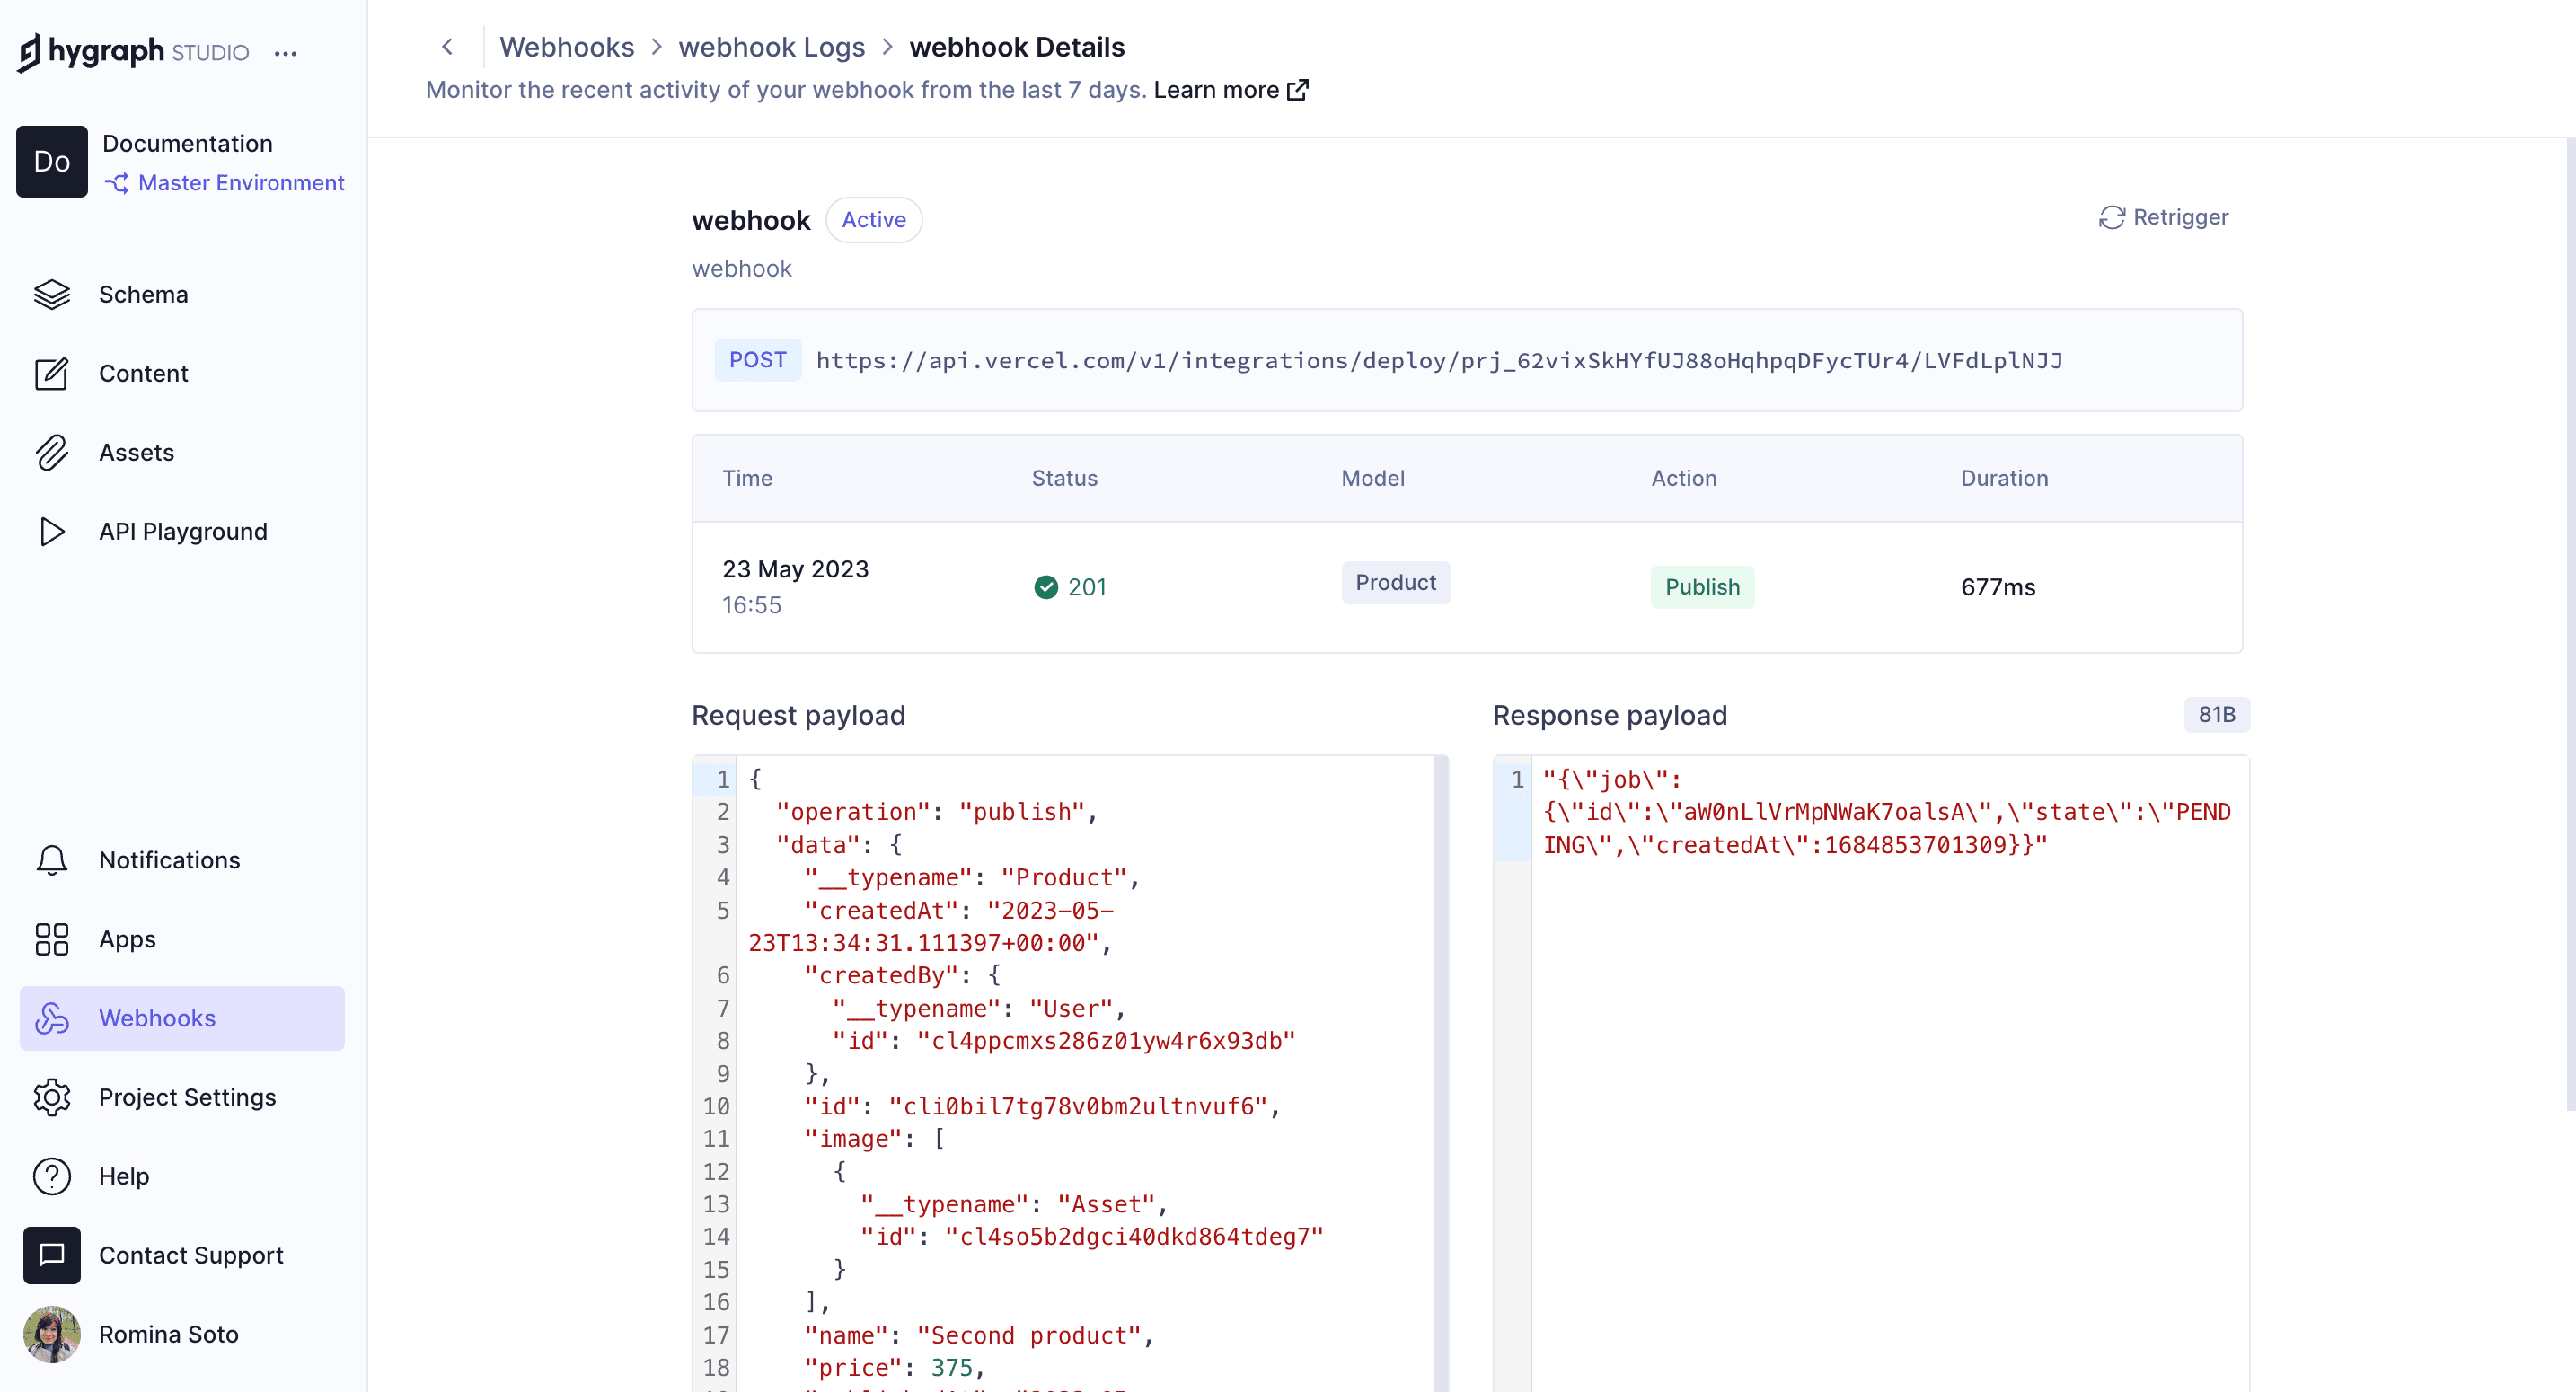
The logs screen will display as a result. This screen allows you to monitor the recent activity of your webhook from the last 7 days.
Clicking on a log item displays its details:
 Webhook logs
#Disable or enable a webhook
 Webhook status
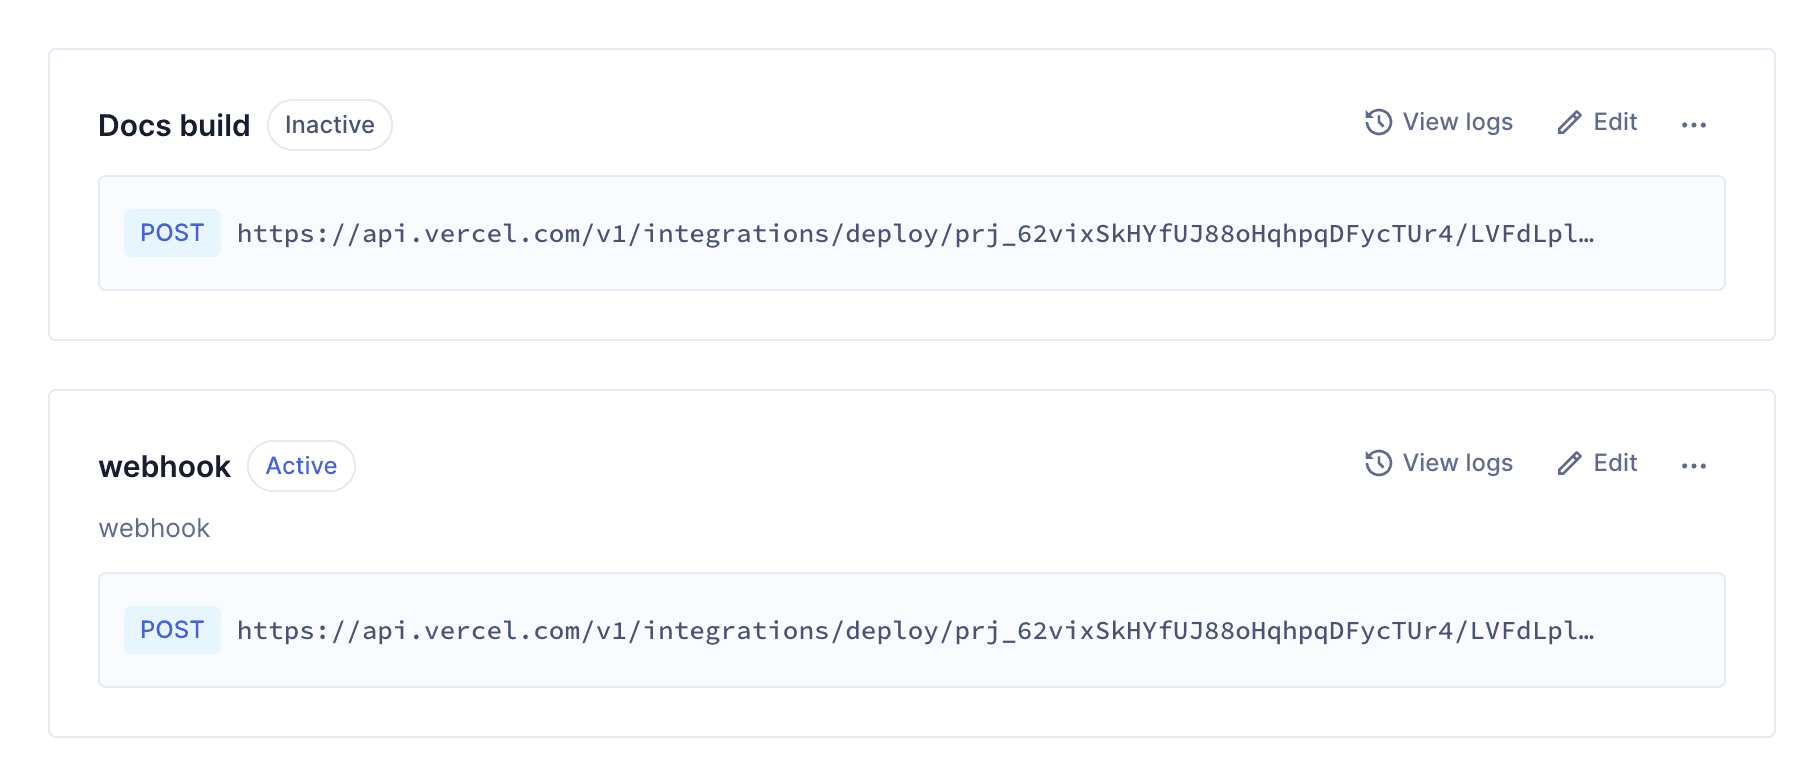
You can see whether a webhook is set to Active or Inactive next to its name on the webhook card.
 Disable a webhook
To disable or enable a webhook, use the context menu and select Pause / Resume.
#Edit or delete a webhook
 Webhook - Edit and delete icons
Click on the context menu and select Delete to delete the webhook, or on Edit to edit its details. You can learn more about each of the fields you can edit here.